The Startup Founder’s Guide to Financial Modeling (free templates included)
Master Revenue, Cost, and Cash Flow Drivers to Scale Efficiently and Avoid Running Out of Cash
As a founder, your primary responsibility is clear: make sure your company doesn't run out of cash. Without the funds to operate, achieving product-market fit becomes impossible—no money, no growth. If your business isn't yet profitable, your runway shrinks with each passing day, and the risk of running out of cash looms larger. Preventing this requires two things: reaching cash flow positivity or raising capital before the runway ends. Both paths demand careful planning and diligent cash flow monitoring; good luck achieving this without a solid financial model.
In this guide, we’ll explore what constitutes a solid model and which core assumptions/variables a founder or investor should focus on. We also include a few resources to help streamline the process.
The Key Elements of a Financial Model
A comprehensive financial model revolves around three core components:
Revenue Drivers
Cost Drivers
Non-Operating Drivers (e.g., payment collections, interest payments, depreciation)
Let’s unpack each one.
Revenue Drivers: Fueling Growth
The exact revenue drivers depend on your industry and business model. When looking at your Revenue Drivers you have two ways of building your funnel:
Top-Down: Start by setting your revenue target, then figure out what you would need to accomplish to reach this goal.
Bottom-Up: Plug in your assumptions/observations around your sales and marketing performance, to see how this would impact new sales.
The model can be built either way, and depending on its purpose, it’s common to combine these methods. For more mature companies, most of these metrics should be easily observable. For newer companies or existing businesses looking to launch new business lines, you will instead need to rely on assumptions or benchmarks (link to benchmarking article from VC Corner).
Average Sales Price per unit or subscription period (monthly, annually, etc.). If you sell one product/service with only one tier, this should be fairly simple. However, if you have many different revenue streams with different adoption rates, it might require many assumptions and granularity. If you are building your model top-down, you could start with a revenue target and an assumption of how much you will make per user to figure out how many customers you would need to acquire.
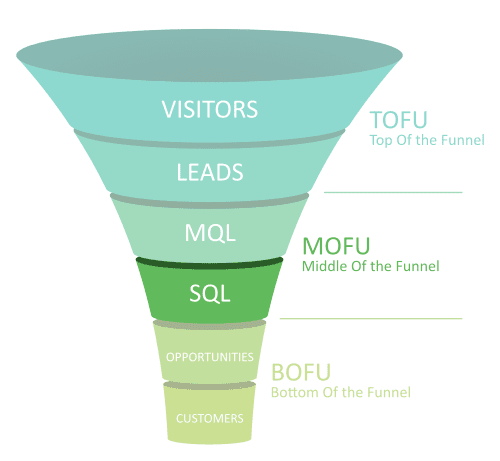
Sales Funnel Metrics if you are building a bottoms up model, instead of taking revenue target divided by your estimated average sales price, you might instead figure out how many customers you expect to convert by looking at top of funnel metrics starting with marketing leads. This will help you trace the journey from a dollar of marketing spend, all the way into revenue. When your marketing or growth lead asks for more budget, you can try to translate how this will eventually translate into revenue. Some of the metrics you would need to factor into your model would be:
Win rate percentage (from qualified opportunity to closed won deal)
Conversion from marketing qualified lead to sales qualified opportunity (MQL to SQL)
Sales cycle length (length from when a lead/prospect enters the funnel until a new customer is acquired)
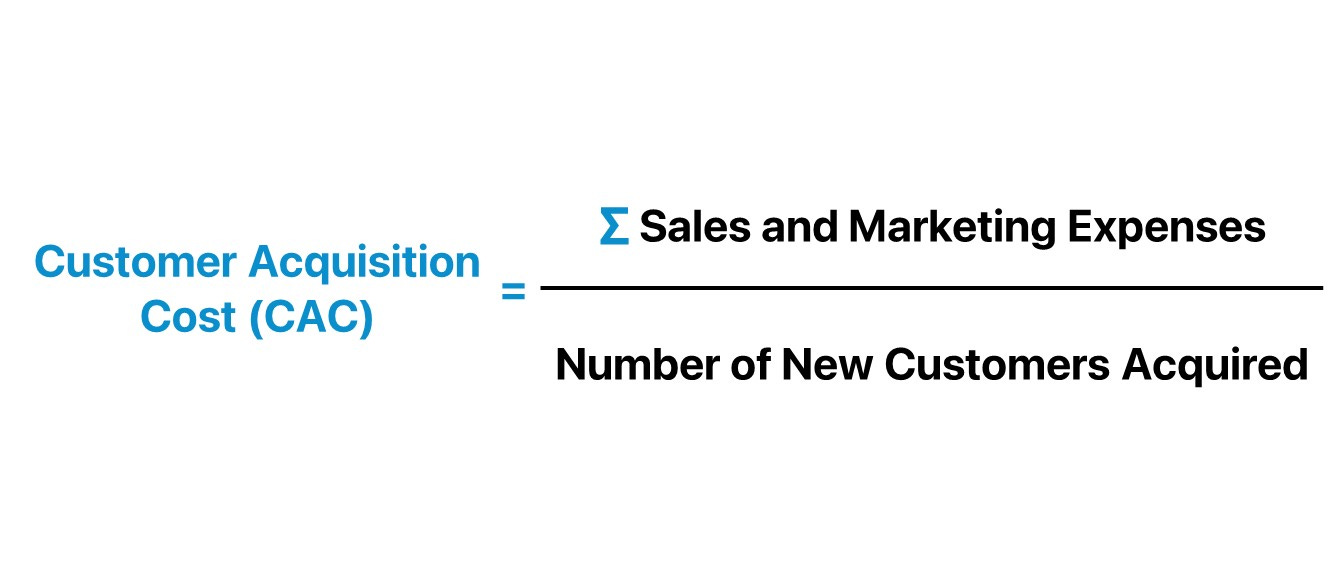
Customer acquisition: If you opt for the bottom-up approach, you could trace the whole journey of your marketing spend and figure out how changes in your conversion rates impact the amount you need to spend to acquire a customer. If you don’t have this information or want to calculate it quicker, you could rely on benchmarks for how much it costs to acquire a customer. You could then use this information to evaluate your unit economics and set your marketing budget.
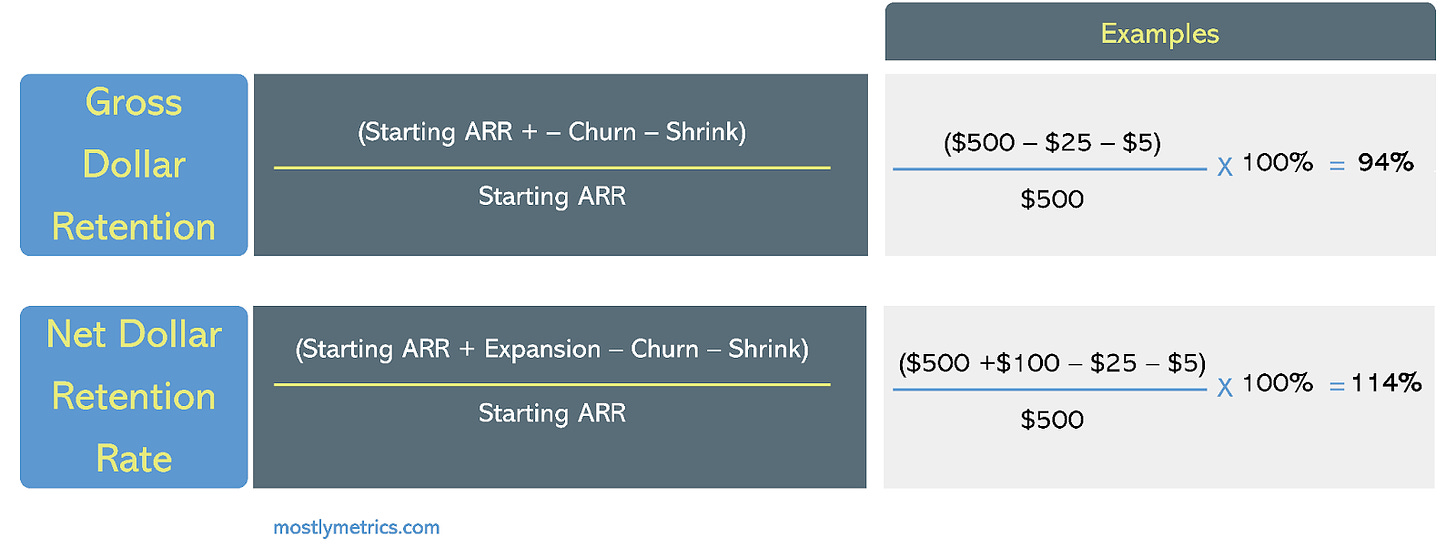
Retention rates: Once a customer is acquired, the frequency in which they continue to purchase from you is a major driver for a businesses long term success. Understanding how long a customer will continue to pay for your service and if they pay more or less overtime will help inform how much it makes sense to invest to acquire a customer. There are two ways to evaluate retention
Gross Retention: Looking at a cohort of customers you acquired, what % of these customers are still active X months or years later? Alternatively, from the original revenue base you got from these customers, how much revenue are you still generating? The max gross retention ratio you can have is 100%, since the best you can hope for is to retain this revenue.
Net Retention: Works like gross retention but also factors in any up-sells. Even if you lose some customers, this could be offset by having the remaining customers pay more. Unlike gross retention, net retention has no upper limit and by definition can never be lower than your gross retention.
For venture-backed startups, rapid growth is often a baseline expectation. Understanding these drivers can help you align your growth team and inform product strategy. However, some drivers are easier to control than others. You may set a target price, but if customers aren’t buying at that price, you’ll need to adjust. Maximizing revenue requires finding the apex where the highest feasible price meets the broadest customer base, with strong retention.
These drivers, crucial as they are, only make up part of the equation. To grow without burning through cash, you need a sharp eye on costs.
Cost Drivers: Controlling the Burn
When considering expenses, distinguish between fixed and variable costs. Each has a different impact on your cash flow and growth potential.
Fixed Costs
Fixed costs are not directly impacted by revenue and typically include:
Employee Salaries for developers, general administrative roles, sales and others. Some of these roles might increase the amount of future revenue you generate but an additional $X of revenue would not mean you would need to hire Y more employees. Once hired, whether sales increase or not, these costs are recurring each pay cycle.
General & Administration costs: this could include business insurance, office expenses, financial audit or technology certifications (SOC2, ISO 27001 etc.).
Software licenses most SaaS tools you buy are generally tied to number of seats, employee count or usage. This could be your HR software (UKG, Rippling, Culture Amp), your CRM (Hubspot/Salesforce), any developer tools (Co-pilot, Cursor, Chat Gpt)
These costs climb in “steps.” As you scale, adding more customers may eventually require more employees or infrastructure, but you have control over the timing of these increases. Fixed costs are easier to manage in lean times than variable costs, as delaying hiring or trimming non-critical roles typically doesn’t immediately impact revenue.
Variable Costs
Variable costs are directly tied to your revenue. Examples include:
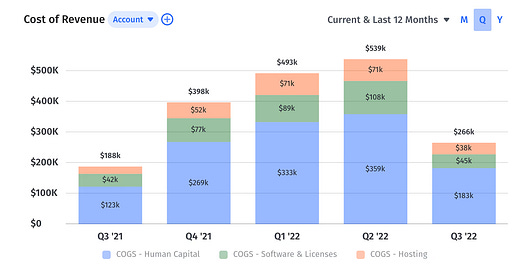
Cloud hosting fees for SaaS companies. Each additional customer will carry additional charges, if you don’t pay for these fees, you cannot offer service.
Interchange and service fees for fintech firms. These normally come from Visa, Mastercard or a financial infrastructure firm and are structural. You cannot accept or provide payment services if you don’t incur these fees.
Customer support expenses. Whether you outsource customer support or need to scale up your team, more customers will increase your CS costs, even if they are not 100% proportional.
Most unit economics judges will include customer acquisition and support expenses within the variable cost components. If your customer acquisition cost (CAC) exceeds a customer's lifetime value (LTV), you risk losing money on every sale. As a founder, finding the optimal balance between growth, margins, and acquisition costs is vital to avoiding unit economics that erodes profitability.
With your revenue and cost drivers mapped, you’ll better understand your profitability timeline and funding needs. However, remember to also consider non-operating costs.
Non-Operating Drivers: The Cash Flow Catalysts
Beyond revenue and cost, several non-operating factors can impact your cash flow and, ultimately, the capital required to keep the business alive.
Working Capital
Payment terms and collection timelines are crucial. For instance:
Payment Terms: Do customers pay upfront, annually, or per use?
Collection Terms: How quickly do you receive payments—Net 30, 60, 90 days?
Even with strong unit economics, delays between paying suppliers and receiving customer payments can lead to a cash crunch. Faster customer payments can significantly reduce the drag on your cash reserves. On the other hand if you need to pay your suppliers well in advance of when you get paid, you’ll burn more than your unit economics would imply, meaning you need an additional cash buffer to offset this difference.
Depreciation
Depreciation primarily affects businesses reliant on physical assets, such as manufacturing or logistics. Even though it’s a non-cash expense, the eventual replacement of depreciated assets requires real cash. Understanding your asset depreciation schedule can prevent unexpected shortfalls when assets need replacing.
Interest Rates
Interest rates may seem insignificant early on, but they can make a difference as you scale. Deposits sitting idle in your bank account might earn you interest, whereas loans increase your cash burn through interest payments. As you scale, these rates can subtly shift your cash flow.
Building a Model that Empowers Decision-Making + BONUS: 10 Free Templates
Keep reading with a 7-day free trial
Subscribe to The VC Corner to keep reading this post and get 7 days of free access to the full post archives.


